Complexity Made Simple

Redesigning the dashboard builder

The Problem

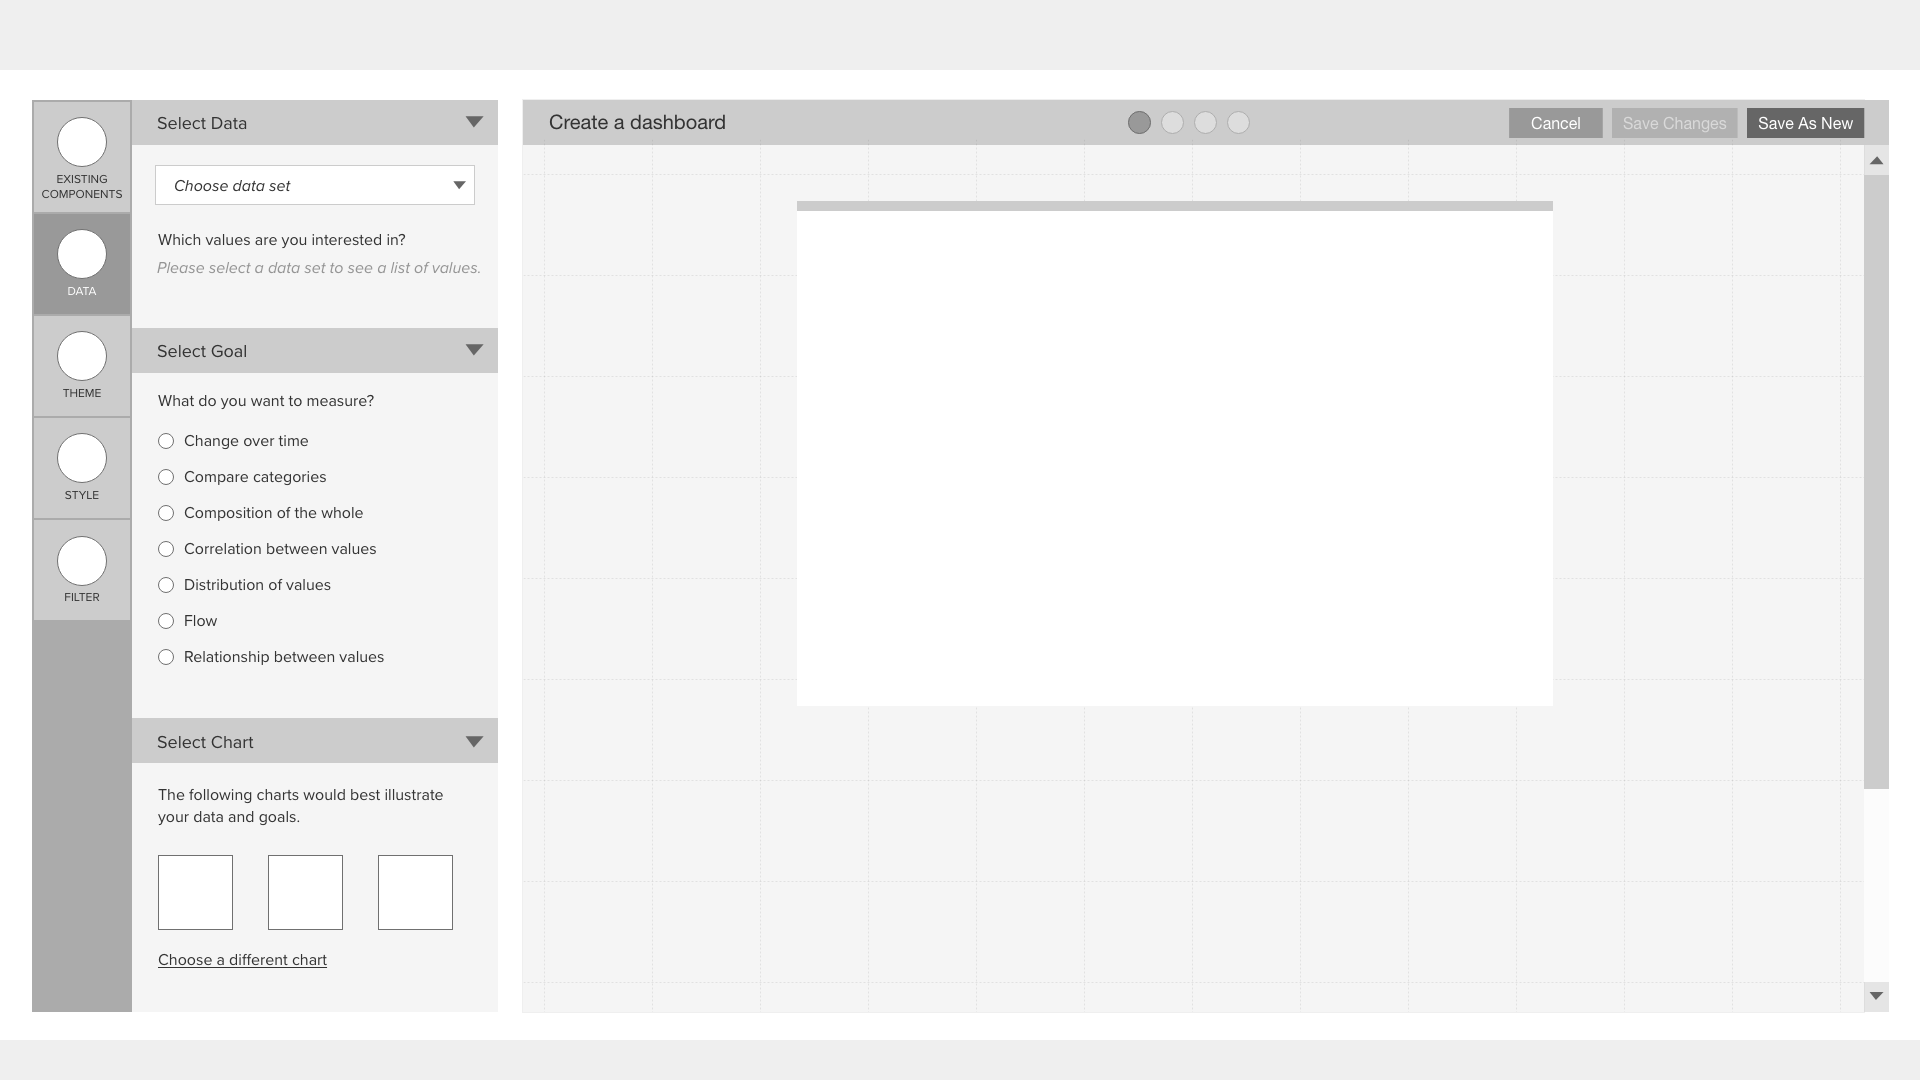
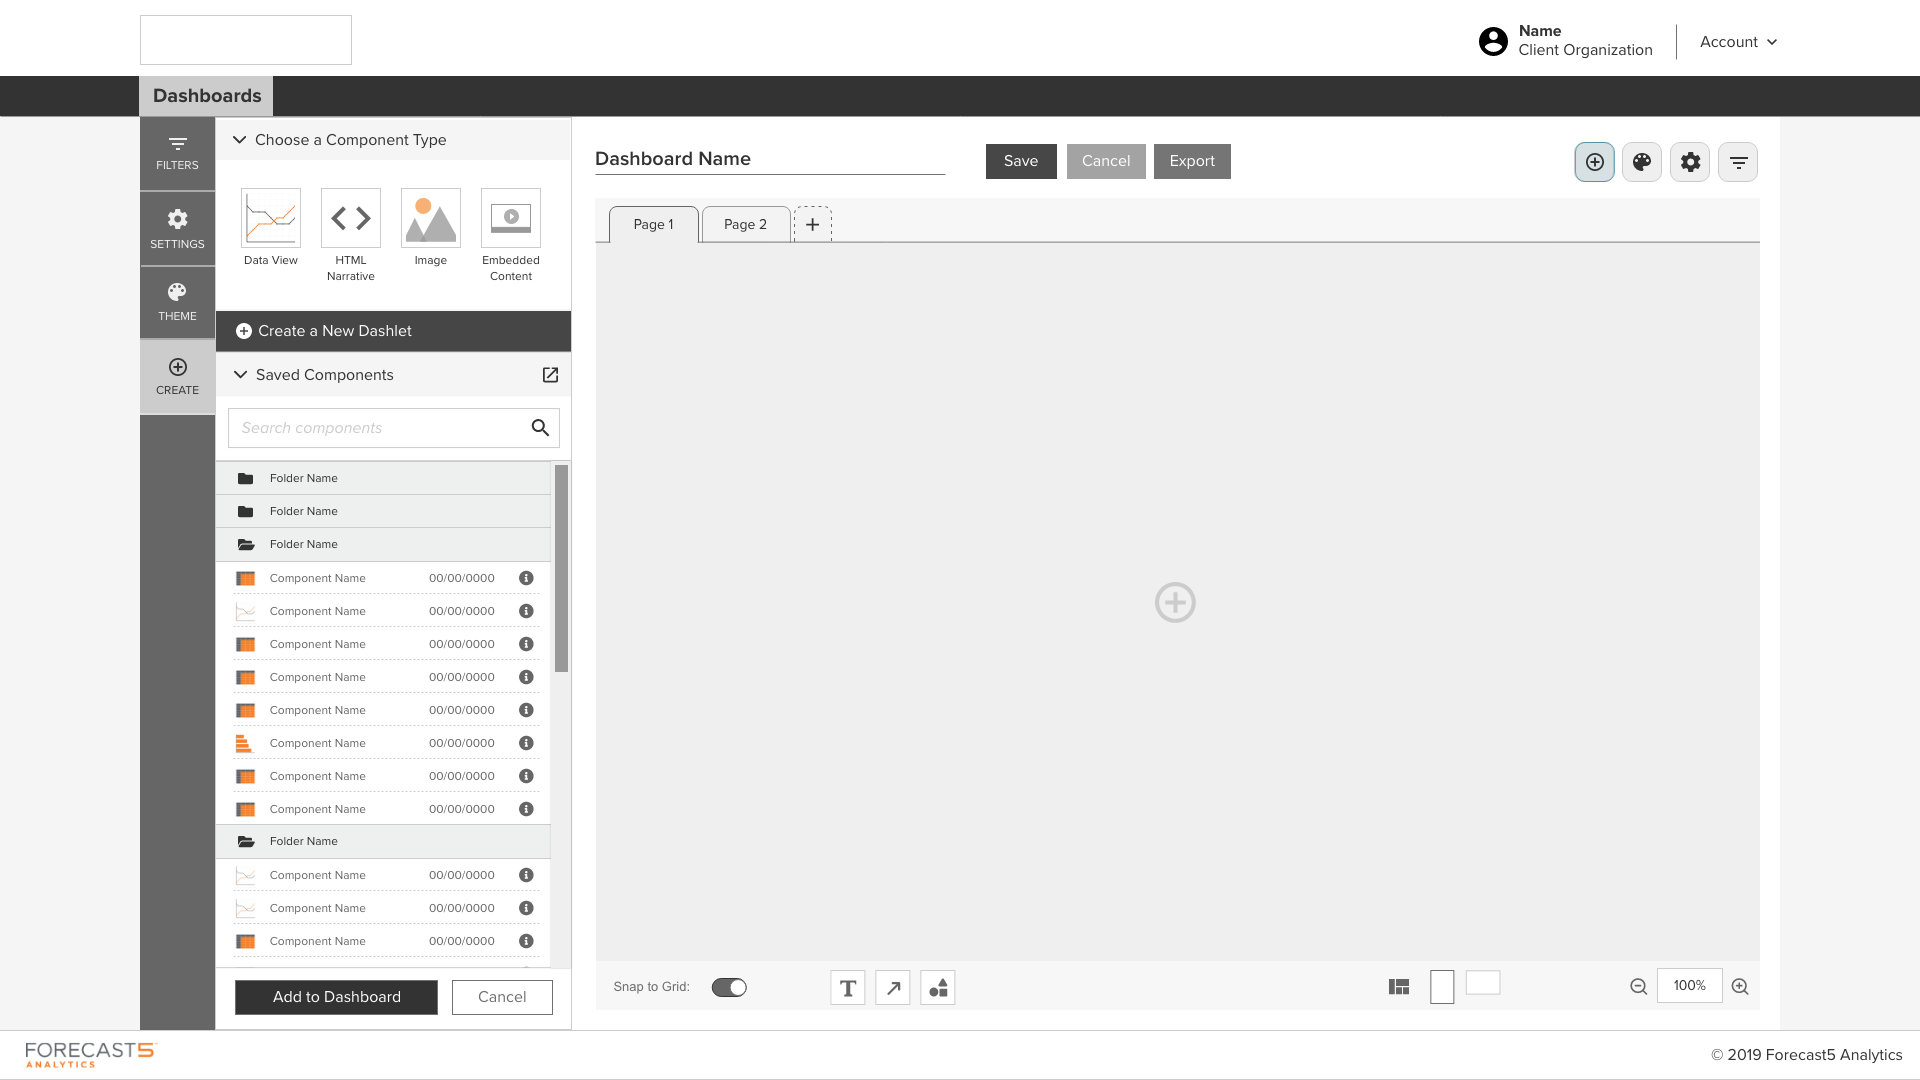
Imagine you’re a school administrator. You want to create a visual for the next school board meeting, but the pre-built dashboards in your data analytics tool don’t match what you need. You click a button to create a new dashboard and you’re met with nothing ... a blank page with no indication of what to do next.

That was the problem facing us when we started the dashboard builder redesign. The most common response to the scenario above is that they would call their product advisor to ask for a custom dashboard, but that took time and resources away from other clients. Our data showed clients were willing to create dashboard themselves. They just didn’t know how.

What users were facing before the redesign

Discovery Research

I started by completing a competitive analysis of existing popular dashboard builders, creating a matrix of features and determining which were available in each product, which settings could be turned on or changed, and which were the default settings, and compared that to the existing tool, which fell short on many levels. I also completed a heuristic evaluation of the current tool to identify general opportunities for improvement.

Armed with this information, I met with the stakeholders (the product owners/advisors and the head of development) and discussed pain points, client-requested features, advisor-requested features, and overall usability. We also discussed the types of users who would be using the application, using personas created earlier for the suite of applications, and brainstormed some solutions to the pain points, discussing features that could be built in a reasonable timeframe, as well as solutions that would work for all the products.

A matrix of features offered by competitors One page of a heuristic analysis with notes

Design

I met with the product owners and SMEs for each product separately to discuss issues unique to their products, as well as what they had heard from clients. Based on these discussions and my previous research, I thought providing templates would be the easiest way to encourage clients to try the tool and would allow us to meet the bar of user expectations for a dashboard tool. The product owners wanted a wizard to walk users through the basics. I started with wireframes for those two ideas.

A wireframe of a dashboard wizard tool A wireframe of a template selection tool

Challenges

Access: My position at the company did not allow me direct access to any customers. I had to rely on the product advisors - who spoke with several customers daily - to provide information and to work with customers on testing out potential solutions. This led me to working directly with the advisors and product owners instead of the larger group when creating preliminary designs.

Timeline: When we began the project, there was no clear end date in mind, but once I set up time to review my initial work with the larger group, the CTO stated that he wanted this tool to be built and ready to show at the company's annual conference for clients, which was only a couple months away. We did not have time to build out all the features we wanted and he did not want to show a prototype to clients.

Shifting priorities: When determining what our MVP would be, it became clear that development leadership and the product owners were not in agreement with what the goal was. The CTO wanted to develop a tool that made it easier for advisors to create dashboards. The product owners wanted a tool that would work primarily for clients, but that advisors could also use when necessary. Ultimately, due to time constraints and lack of development resources, we agreed to create an MVP tool geared toward advisors as the CTO requested.

Redesign

Focusing the design on advisors rather than clients meant moving away from a wizard and back into a more complex UI. Several rounds of wireframes were produced and reviewed by the whole team for input.

When introduced to development, there was additional discussion around features and what was feasible, and additional edits were made. This included removing the templating feature since there wasn't enough time to build it out.

Because the long-term goal was still to encourage clients to try the tool for themselves, the MVP design focused on making each page more intuitive and included a stepped navigation to make the steps clearer.

High fidelity wireframe of a dashboard creation page High fidelity wireframe of a component selection tool

Results

The dashboard builder redesign was initially launched with one product (5Maps) when that product's redesign was also launched. Initial client feedback at the conference and to advisors was positive, and client use increased, especially after additional training. Further iterations focused on making the product more aligned with competitors were planned.

Dashboard builder MVP within an application
back to list